
Math Conversion Charts are printable resources for K-5 classrooms and homeschool settings. Each free math conversion chart addresses the core measurement concepts your students need: length, weight, volume, among others. They include both standard and metric conversions that align with standards. These elementary conversion charts for math are available as PDF downloads, perfect for use as classroom anchor charts, student reference materials, or homework resources.
Conversion Charts
These math conversion charts work best when kept visible throughout the school year for ongoing reference. Encourage students to reference the charts independently rather than asking for help immediately, building their confidence with self-directed problem-solving. The charts are particularly valuable during hands-on measurement activities, word problem sessions, and when students are working with real-world applications like cooking measurements or science experiments.
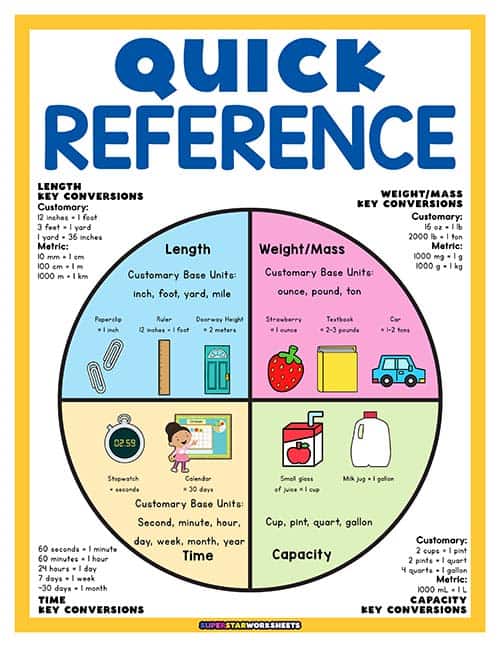
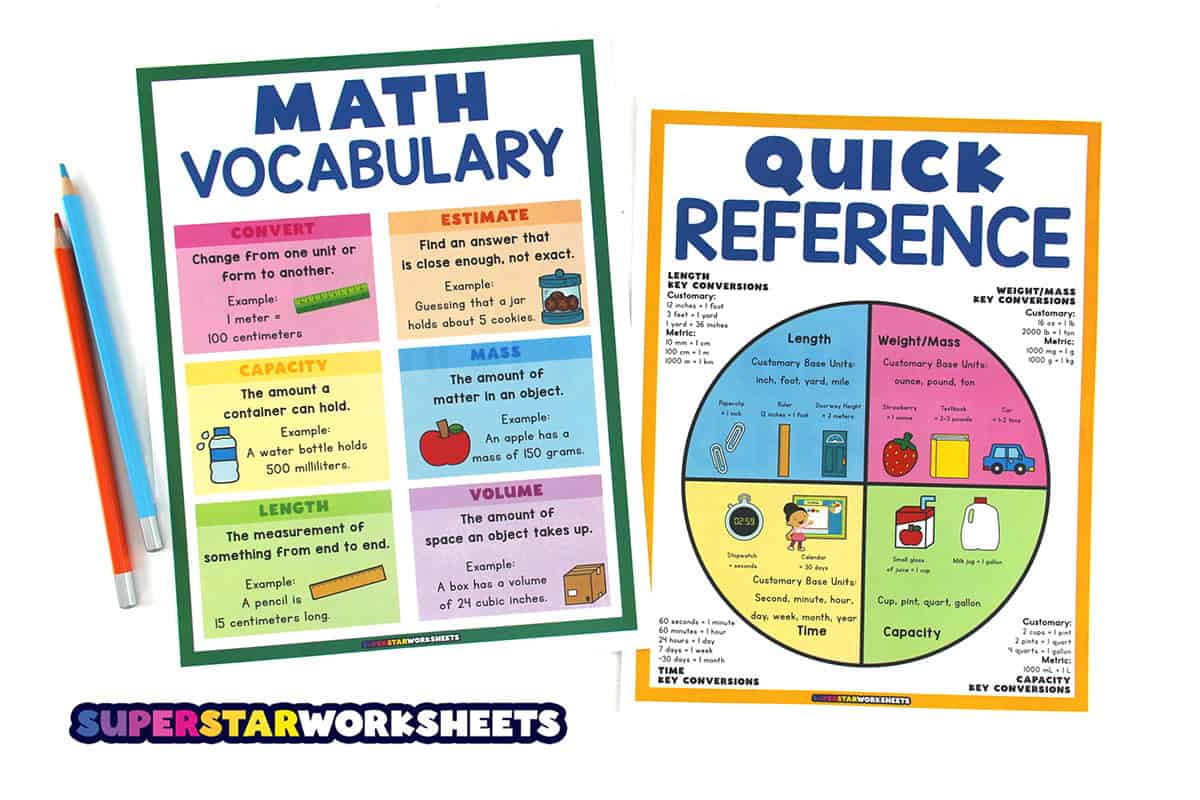
Conversion Quick Reference Poster
This comprehensive printable quick reference poster combines all essential measurement conversions for length, weight, capacity, and time in one convenient circular design with visual examples. The free PDF resource serves as an all-in-one classroom anchor chart that students can reference for any measurement conversion need throughout the school year.
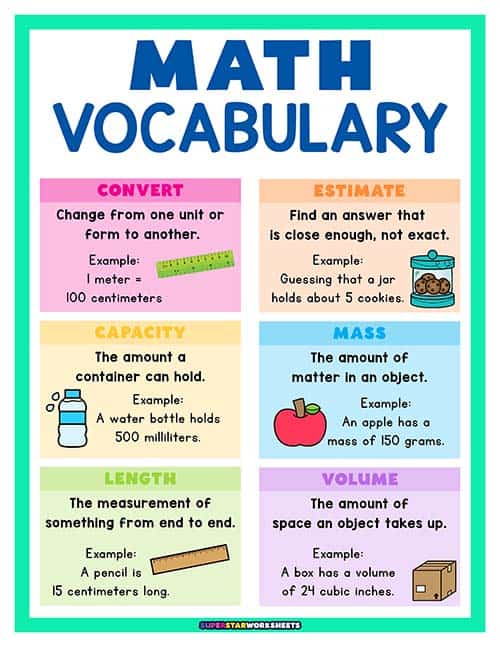
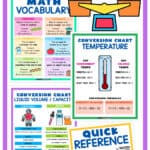
Math Vocabulary Reference Chart
This colorful printable math vocabulary poster defines essential measurement terms like convert, estimate, capacity, mass, length, and volume with clear examples and visual aids. The free PDF download helps students build their mathematical language skills while providing quick reference definitions during measurement activities and problem-solving sessions.
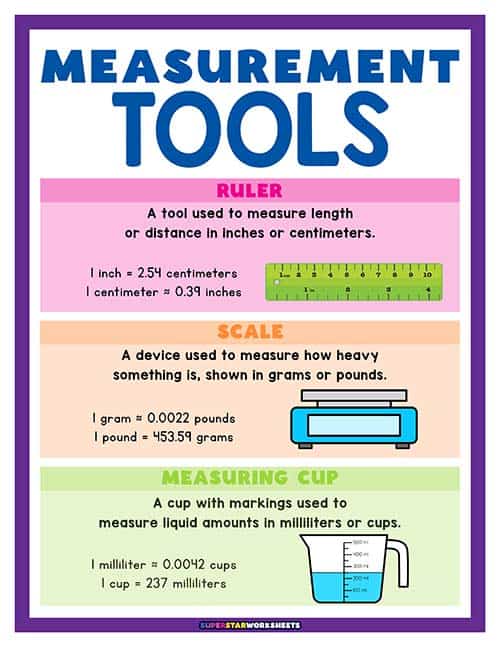
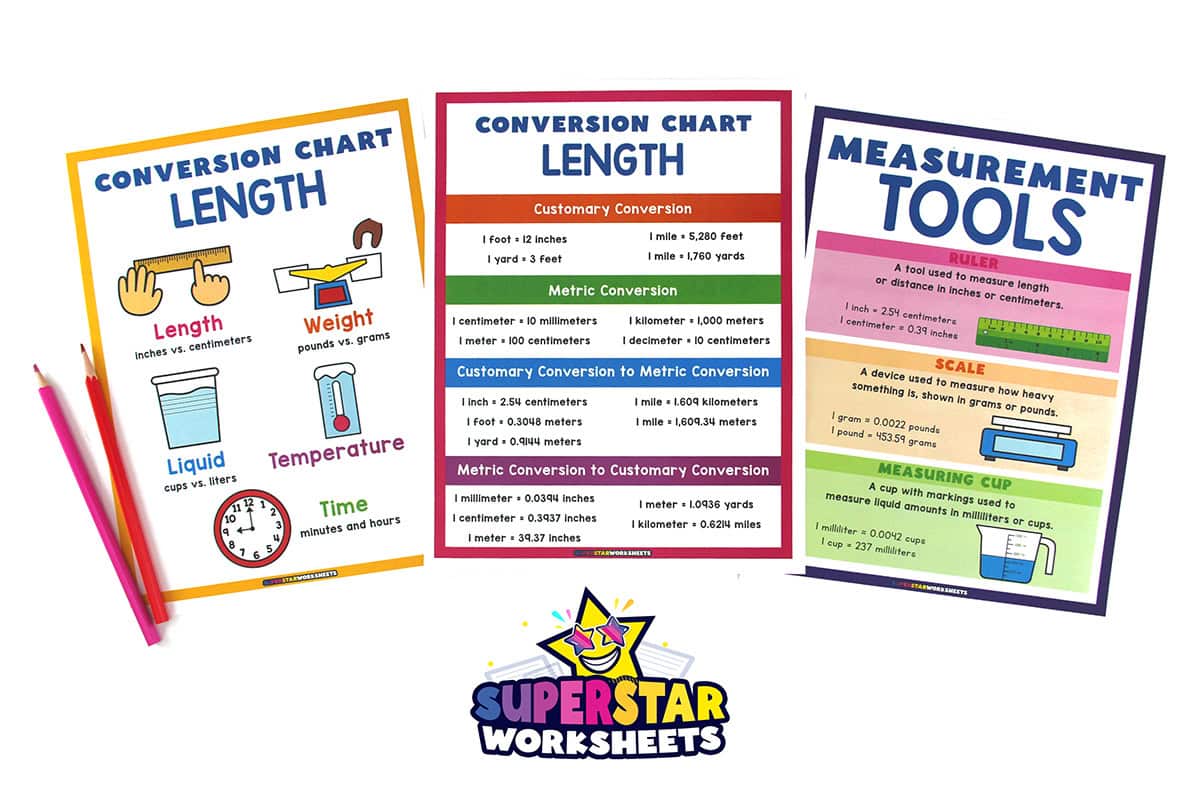
Measurement Tools Match Up
A free printable poster showing how to measure using a ruler, a scale, and a measuring cup. This is a great reference poster for students in grades 2-5.
K-2 Elapsed Time Conversion Charts
For a more durable resource, laminate individual copies for student math folders or homework packets, as students often need conversion support beyond the classroom. Encourage students to regularly incorporate their learning posters into their activities, creating an Interactive Math experience.
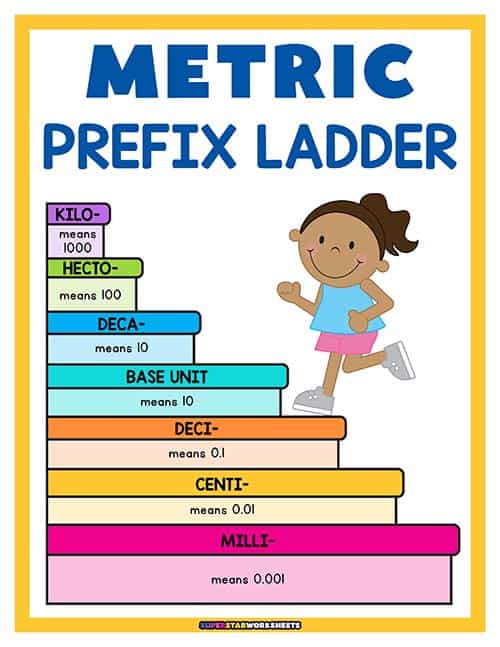
Metric Prefix Ladder Chart
A visual ladder format to help students understand metric prefixes from kilo- down to milli- with clear conversion relationships between each level. A free printable resource for your elementary students.
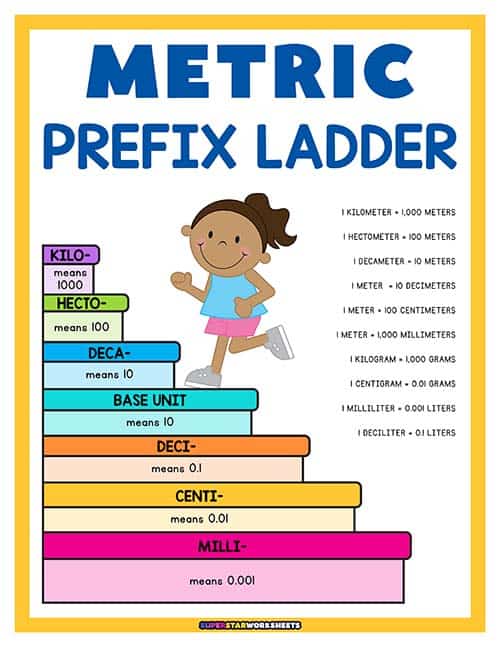
Metric Prefix Ladder Poster Printable
A prefix ladder resource for students learning metric units. This page features the same bright colored ladder from above, along with a conversion guide on the right.
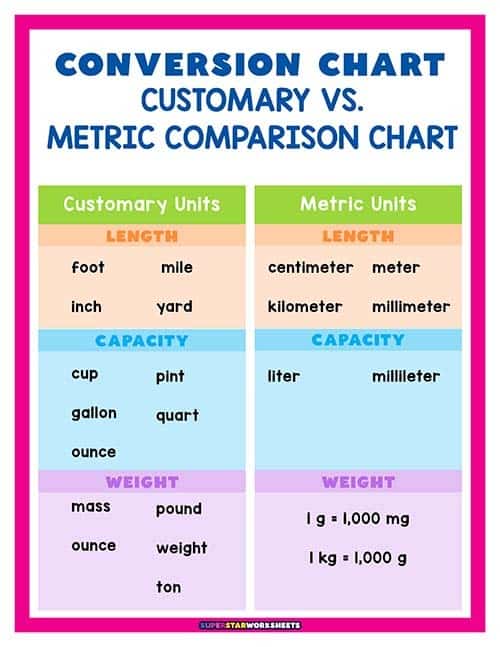
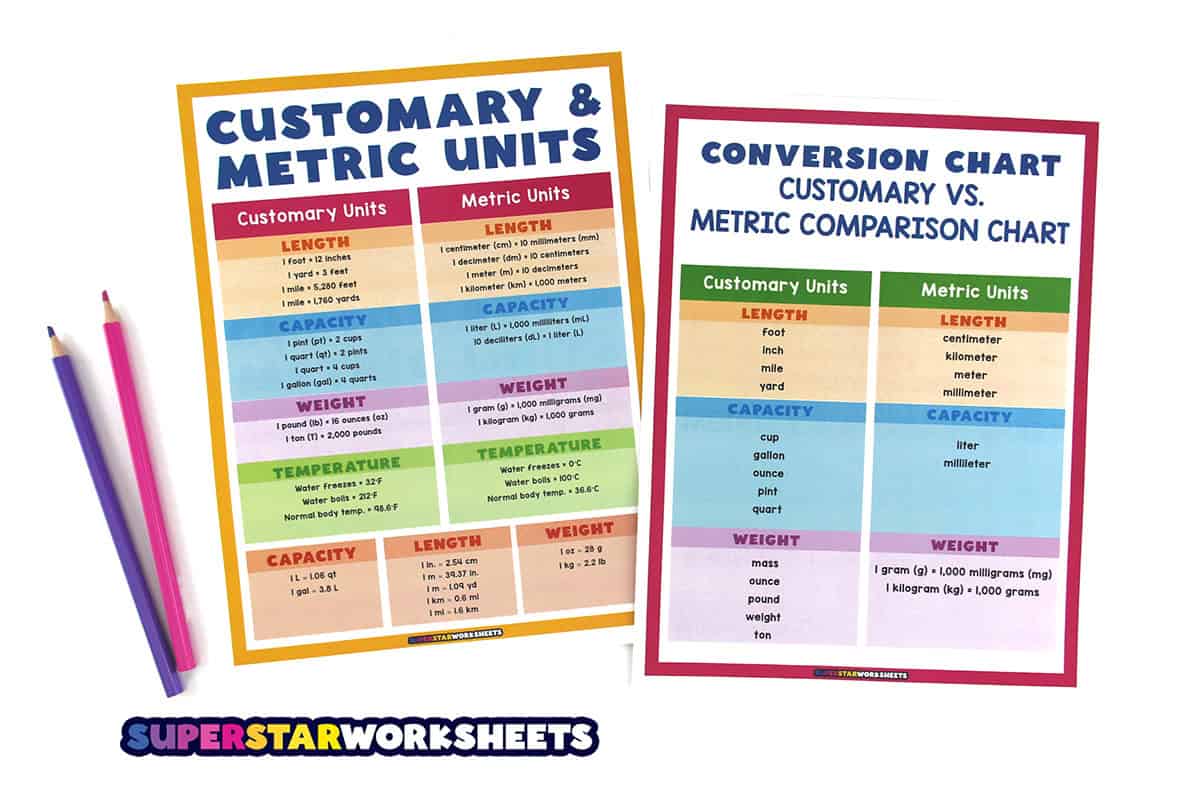
Customary vs. Metric Comparison Chart
A printable comparison chart showing customary and metric measurement units. A printable PDF resource showing conversion relationships for elementary learners.
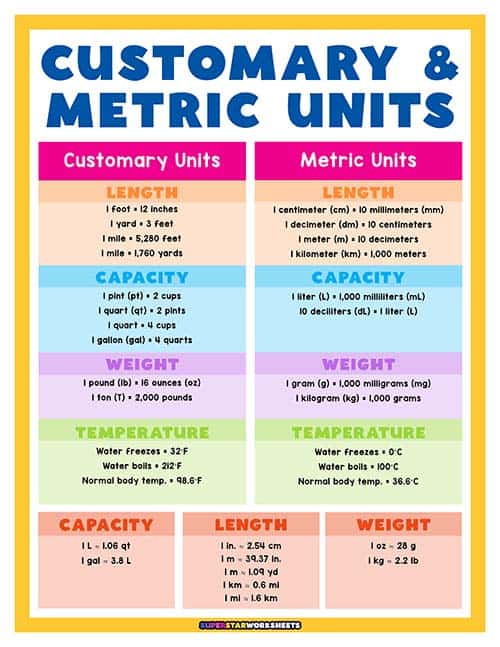
Customary & Metric Unit Conversion Chart
This dual-system conversion chart displays both customary and metric units side-by-side for easy comparison across length, capacity, weight, and temperature measurements. A free PDF download featuring color-coded sections.
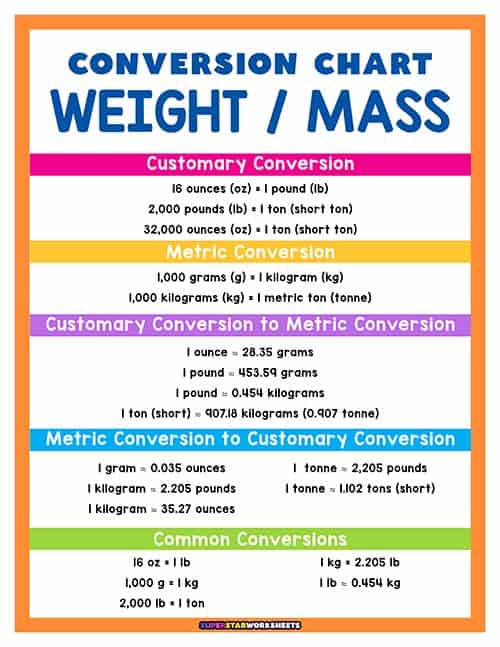
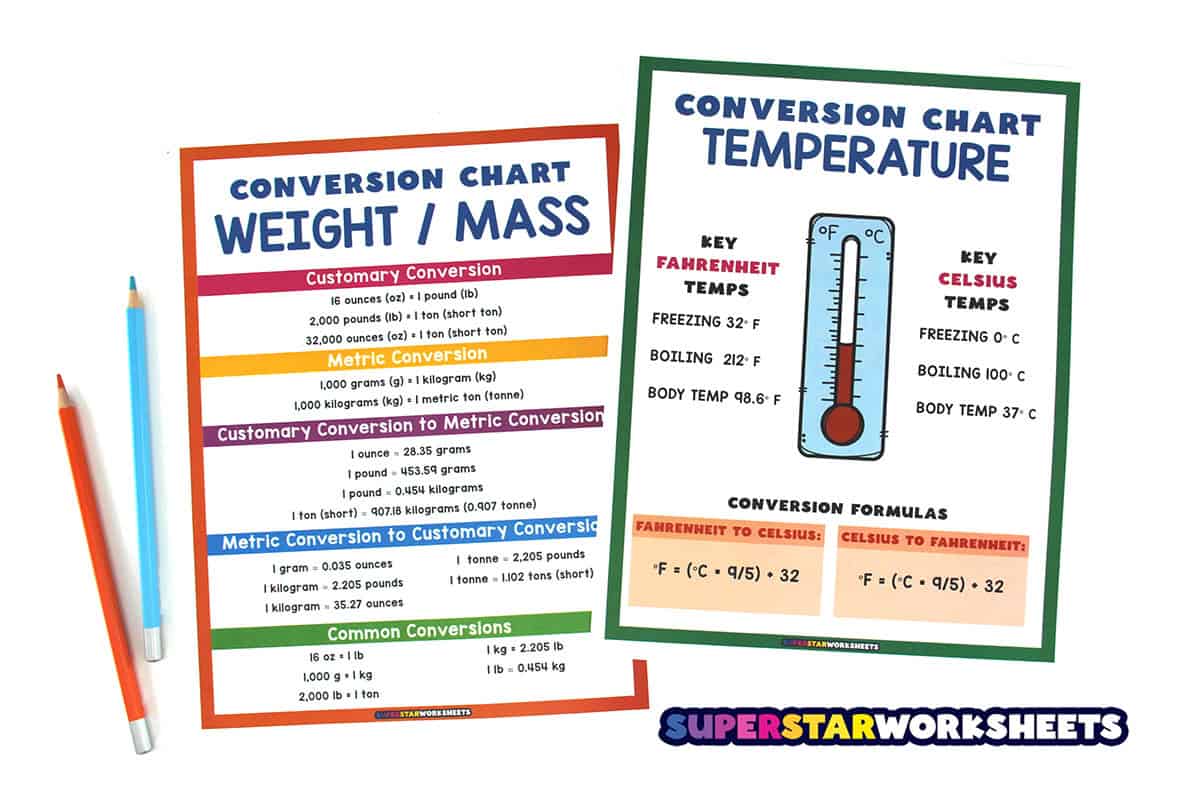
Weight & Mass Conversion Chart
A printable weight/mass conversion chart shows customary conversions and metric conversions. There are also customary to metric and metric to customary conversions to support learning. For more free printable measuring templates try out our Printable Rulers here!
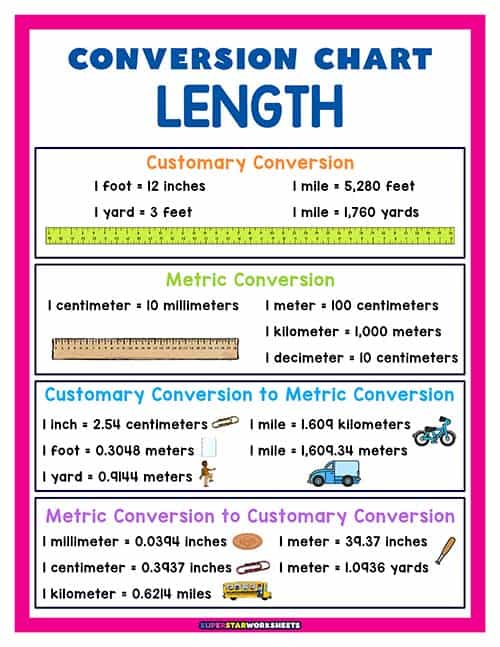
Length Conversion Chart
This length conversion chart covers both customary and metric length measurements with precise conversion factors for classroom reference. The free PDF includes sections for converting between systems and within systems.
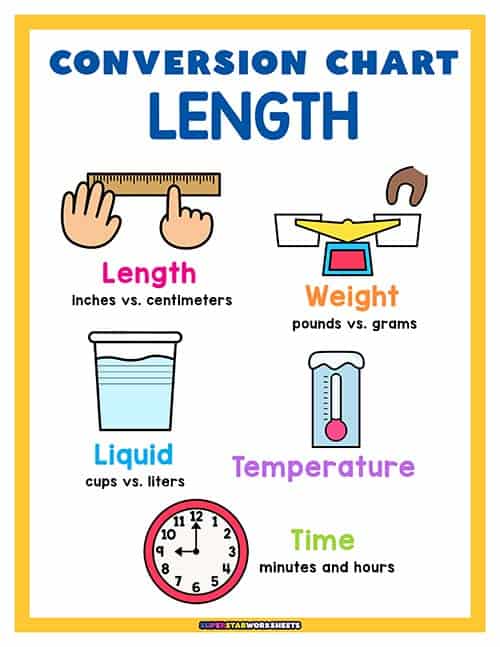
Length Conversion Reference Chart
This free printable length chart shows the five essential measurement categories—length, weight, liquid volume, temperature, and time. A downloadable PDF with a colorful design makes it perfect for classroom display or student take-home materials.
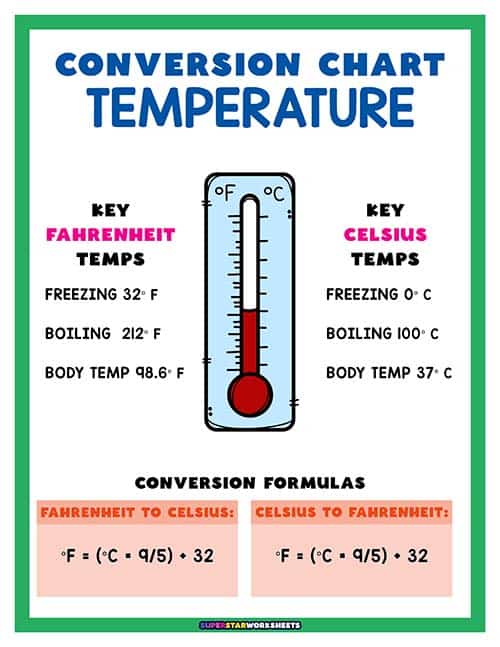
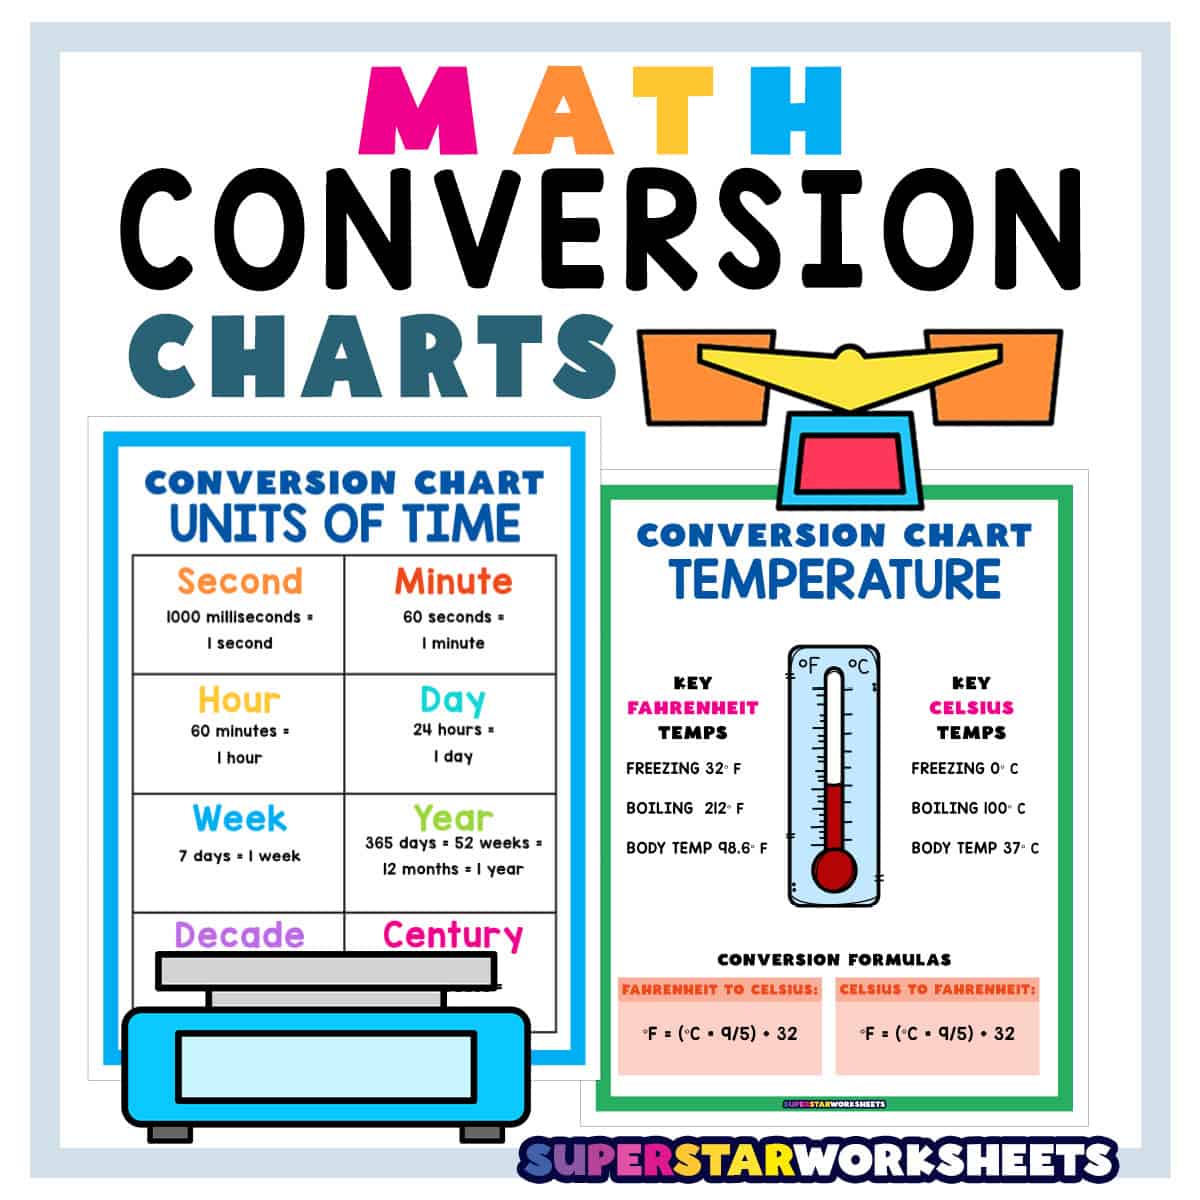
Temperature Conversion Chart
This printable teaches students how to convert between Fahrenheit and Celsius using key temperature benchmarks and conversion formulas. Includes important reference temperatures like freezing and boiling points.
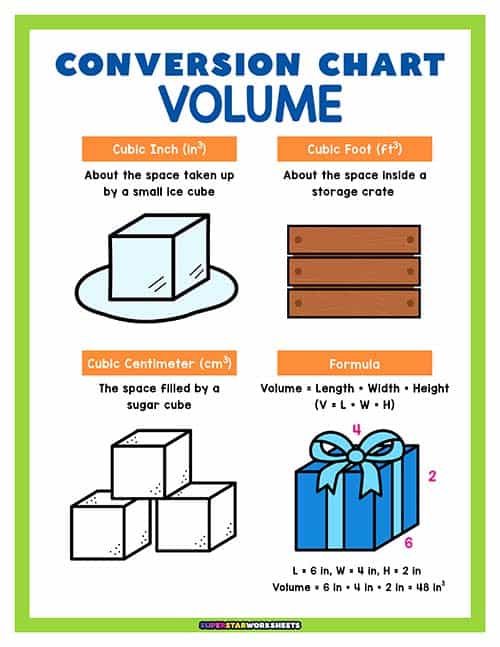
Volume Conversion Chart
A free printable volume conversion chart that shows the formula to find volume. There are also various examples of volume (ice cube, sugar cubes, etc).
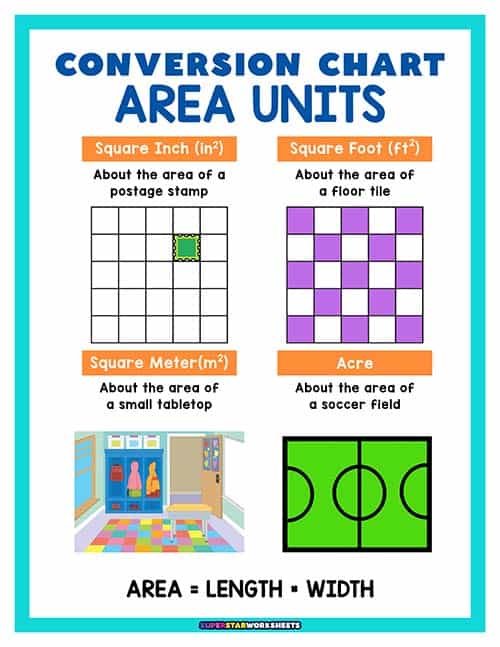
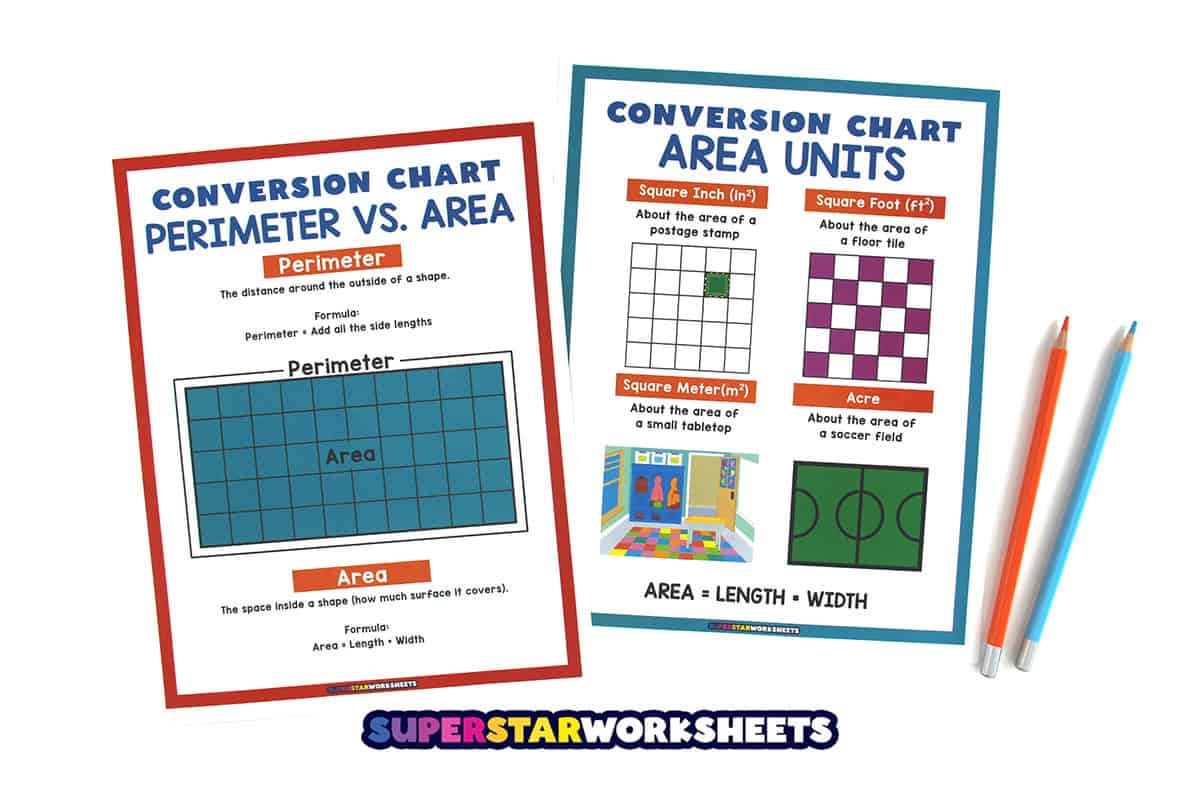
Conversion Chart Area Units
This free printable area conversion chart helps students visualize the relationships between square inches and square feet. The PDF format makes it easy to print multiple copies for classroom anchor charts or individual student reference sheets.
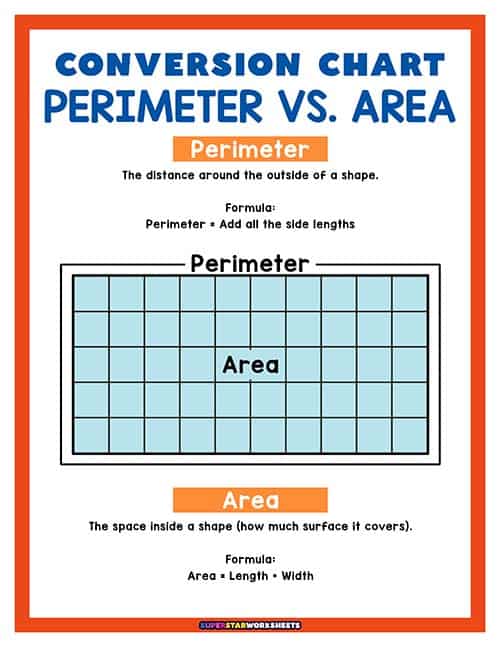
Perimeter vs. Area Conversion Chart
This printable comparison chart helps students distinguish between perimeter and area concepts using visual diagrams and simple formulas for easy understanding. Visual examples make these often-confused geometry concepts easy to remember for elementary students.
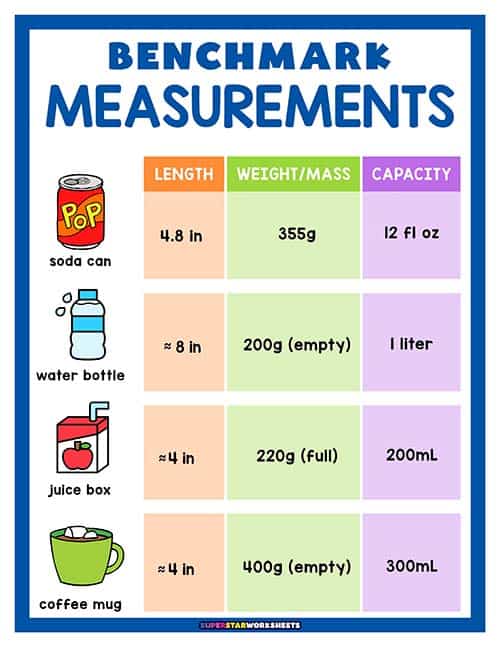
Benchmark Measurements
This printable benchmark measurements poster provides students with familiar reference points for length, weight, and capacity using everyday objects like soda cans and water bottles. A free printable PDF page for homeschool and classroom settings.
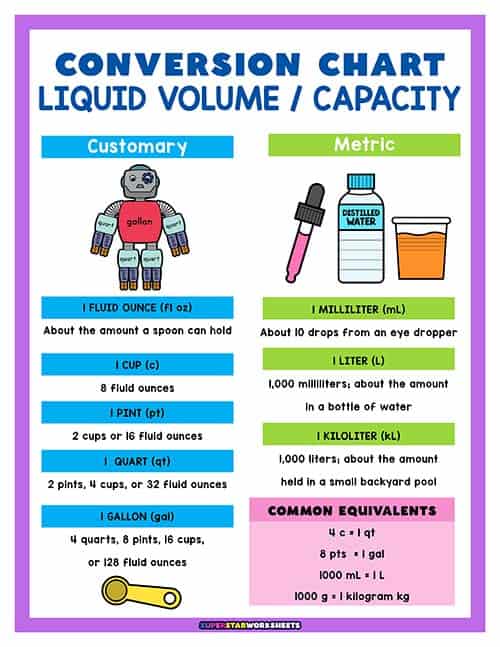
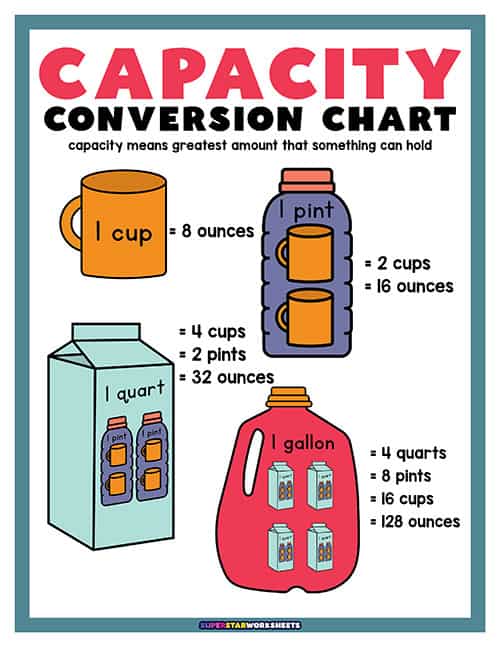
Liquid Volume Capacity Conversion Chart
A printable liquid volume chart that uses visual examples and real-world comparisons to help students understand capacity relationships in both customary and metric systems. The adorable, colorful graphics make this page perfect for elementary students.
Gallon Conversion Chart
Understanding these measurements is essential for daily activities like cooking and baking. It helps students follow recipes and understand space awareness accurately. Bring gallon conversions to life with our Gallon Man printables!
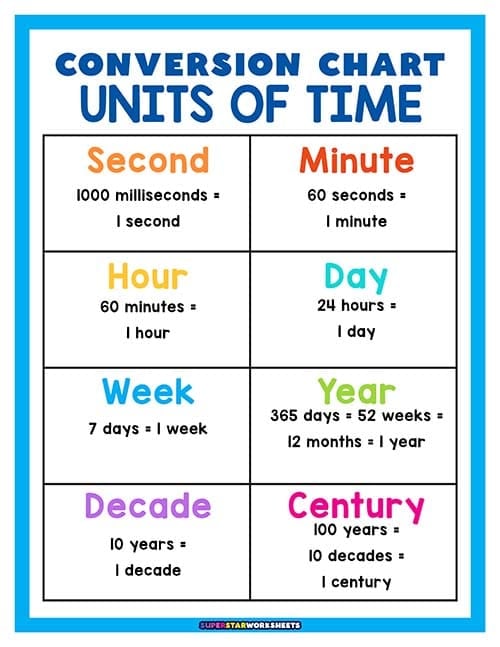
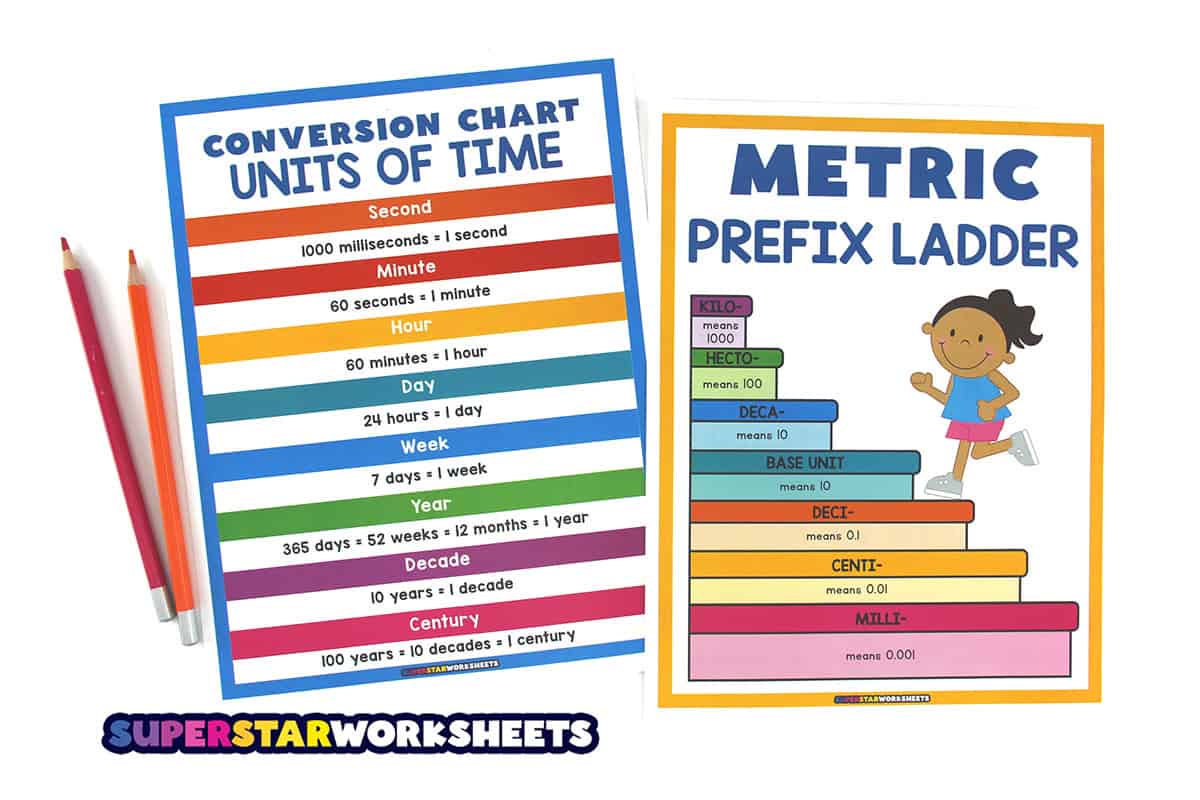
Units of Time Conversion Chart
Convert units of time with this printable anchor chart. From seconds to centuries and everything in between, your students will be able to convert units of time!
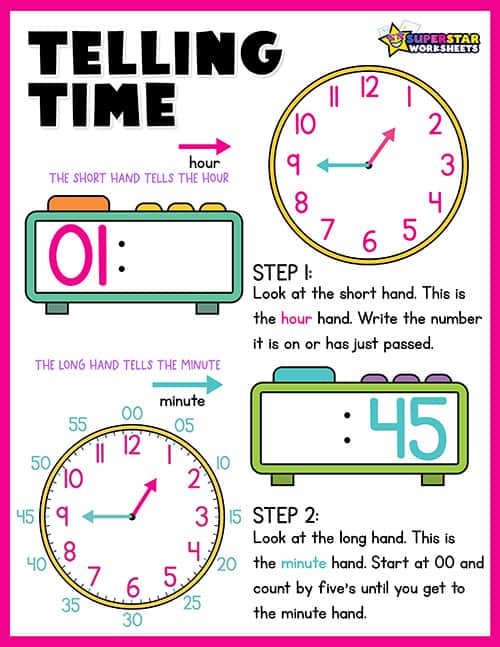
Telling Time Conversion Chart
Use this free printable Telling Time Chart to introduce your students to the process and steps for identifying the current time. This time-telling poster helps students in kindergarten learn time to the hour and half hour, 1st and 2nd graders learn time to quarter hours, and 3-5 learn up to the minute!
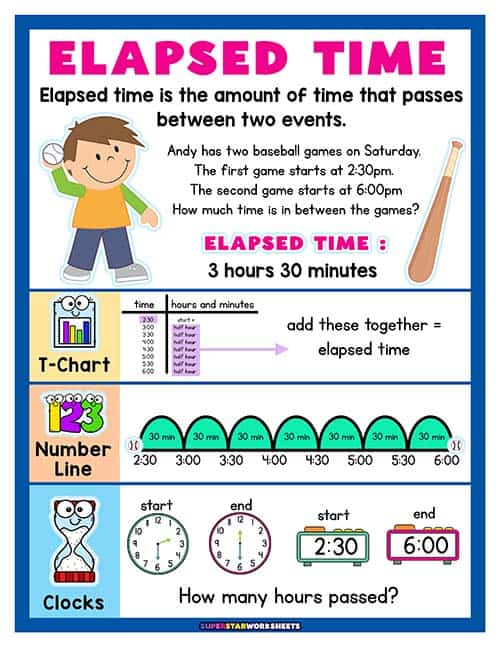
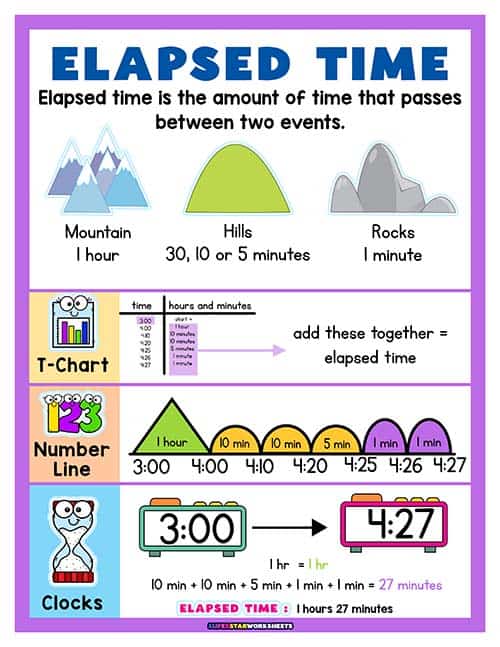
Elapsed Time Anchor Chart
Free printable Elapsed Time chart you can use to teach children three strategies for calculating how much time has passed. This chart features t-chart, number line, and using clocks to count the hours passed.
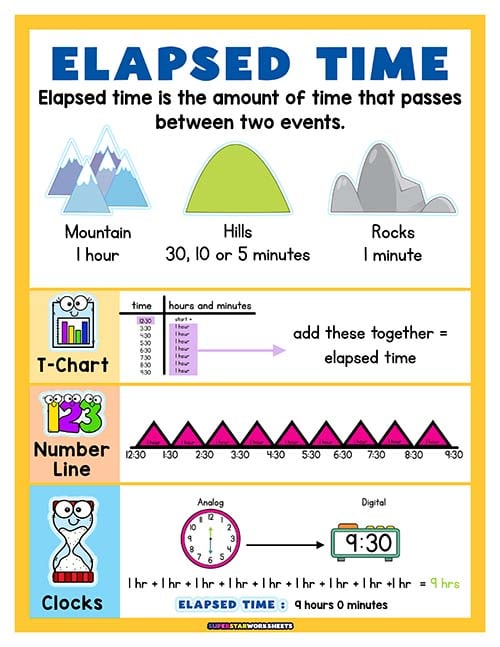
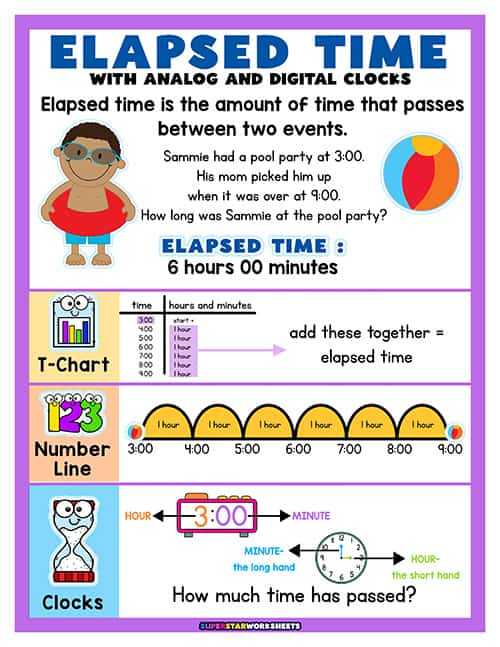
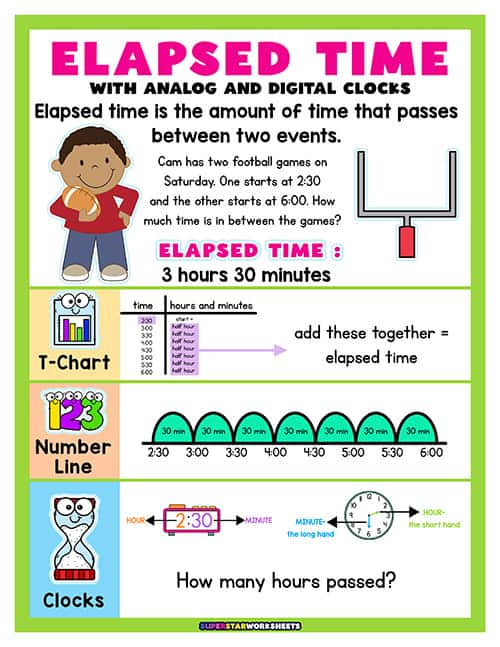
Elapsed Time Anchor Chart: Digital and Analog
Elapsed time chart with both digital and analog clock versions. This anchor chart makes a great reference tool for elementary students in grades 2-4.
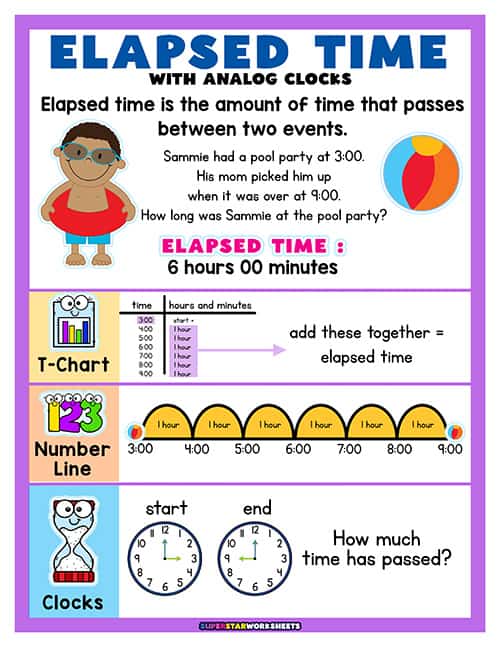
Elapsed Time Analog & Digital Chart: Hours
Using both an analog and digital clock (and the t-chart method), students can reference how to solve elapsed time.
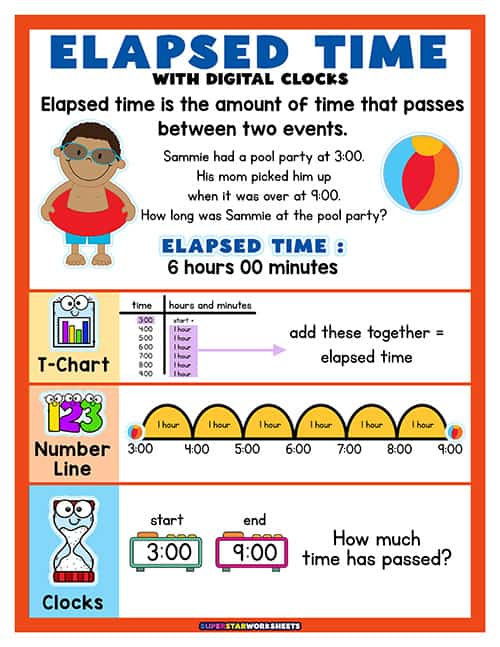
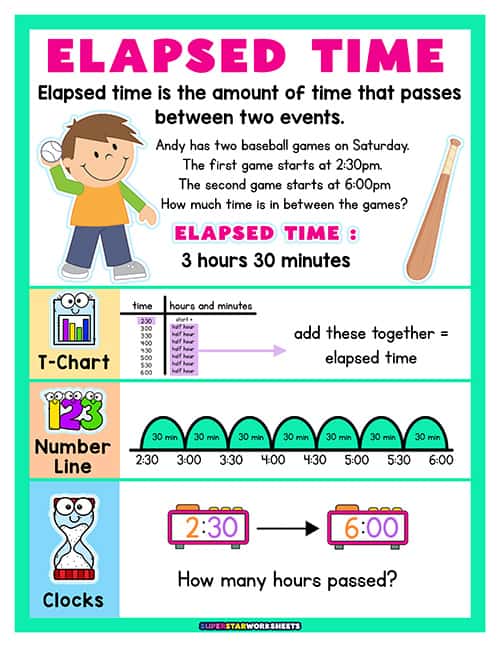
Elapsed Time Anchor Digital Chart: Hours
Solve elapsed time using a t-chart/number line and a digital clock. This is an excellent reference for how to solve elapsed time problems.
Digital Elapsed Time Anchor Chart
This brightly colored, easy to read anchor chart shows elapsed time on a digital clock. It helps teach students how to find the amount of elapsed time.
Elapsed Time Chart Word Problem
Elapsed time is a breeze when using anchor charts! This chart features digital and analog clocks.
Analog Elapsed Time in Half Hours Chart
Half-hour elapsed time anchor chart for students. This resource is perfect to hang in your classroom or add to a math notebook or folder.
Elapsed Time Chart Half Hours
Explain elapsed time with both digital and analog clocks using this free printable anchor chart.
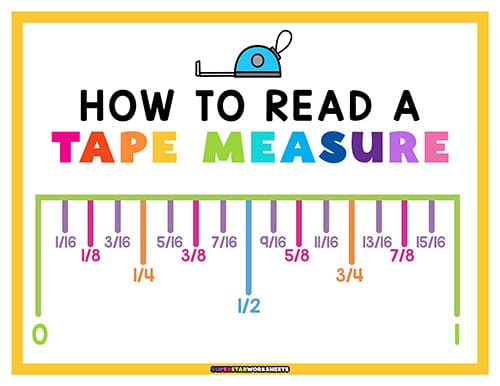
How to Read a Tape Measure Poster
Here is a large, colorful reference chart or mat for students to use in the classroom. This enlarged mat shows a total of 1 inch.
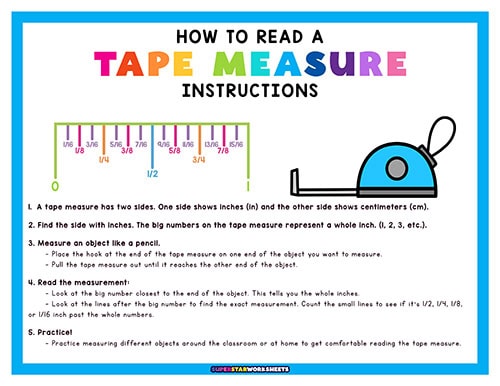
Learning How to Read a Tape Measure
Here is a colorful reference mat or chart with instructions for students to learn how to read a tape measure. Included are the five necessary steps to learn how to read a tape measure properly.
Comment (1)
Thank you!!!!!